
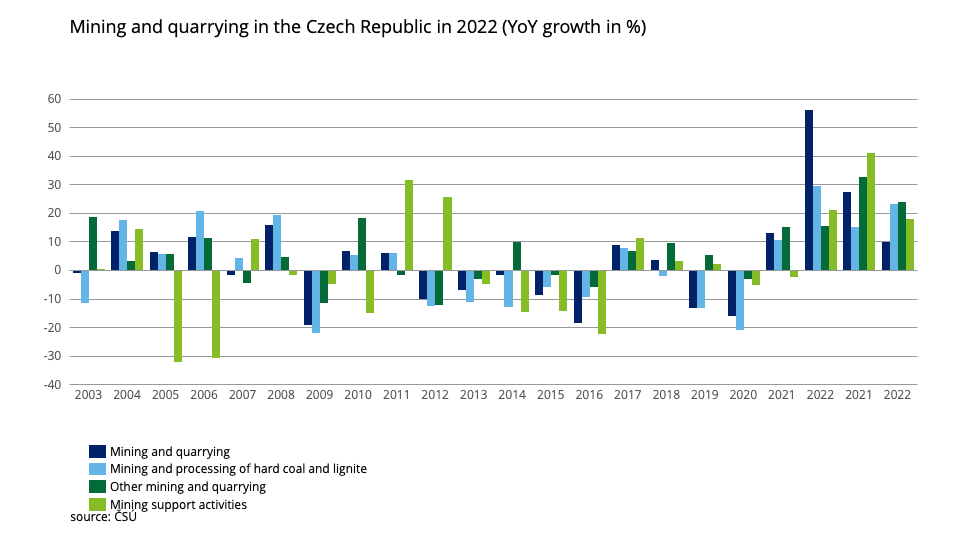
The graph presents year-on-year (YoY) percentage changes in various sectors related to mining and quarrying for the years 2001 to 2022.
The sector of mining and quarrying (YoY % change) shows varying YoY percentage changes over the years, ranging from -18.98% to 56.08%. It experienced a significant decline of -18.98% in 2009, followed by positive growth in subsequent years, with the highest growth of 56.08% in 2022.
The sector of mining and processing of hard coal and lignite (YoY % change) also shows fluctuations in YoY percentage changes, ranging from -21.85% to 29.40%. It experienced a sharp decline of -21.85% in 2009, followed by positive growth in subsequent years, with the highest growth of 29.40% in 2022.
Other mining and quarrying (YoY % change) shows positive YoY percentage changes for most years, ranging from -12.17% to 18.60%. It experienced the highest growth of 18.60% in 2003 and 18.36% in 2010, but also faced declines in some years such as -12.17% in 2011 and -5.66% in 2015.
The mining support activities (YoY % change) shows both positive and negative YoY percentage changes, ranging from -31.92% to 31.78%. It experienced the highest growth of 31.78% in 2010, but also faced significant declines of -31.92% and -30.62% in 2005 and 2006 respectively.
Overall, the mining and quarrying sector as a whole and its subsectors show fluctuations in YoY percentage changes over the years, with periods of growth and decline.
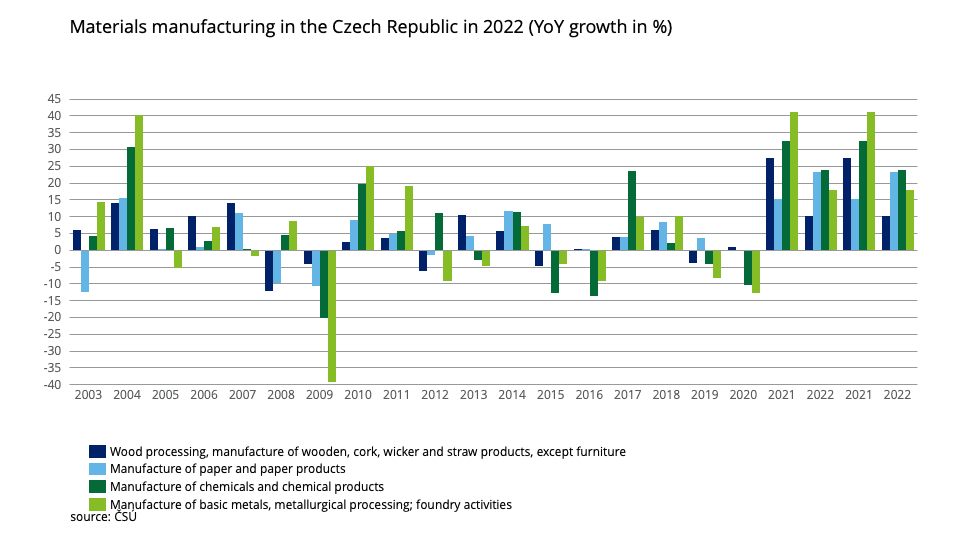
The graph provides year-on-year (YoY) percentage changes in the manufacturing sectors of wood processing, manufacture of paper and paper products, manufacture of chemicals and chemical products, and manufacture of basic metals, metallurgical processing, and foundry activities.
The YoY percentage changes in the sector of wood processing, manufacture of wooden, cork, wicker, and straw products, except furniture varied significantly over the years, ranging from -12.16% to 27.57%. There were periods of both positive and negative growth, with the highest growth rate of 27.57% observed in 2021 and the lowest growth rate of -12.16% observed in 2008.
The YoY percentage changes of manufacture of paper and paper products also showed fluctuations over the years, ranging from -12.46% to 23.28%. There were periods of both positive and negative growth, with the highest growth rate of 23.28% observed in 2022 and the lowest growth rate of -9.84% observed in 2008.
The YoY percentage changes of manufacture of chemicals and chemical products also exhibited variations over the years, ranging from -20.21% to 32.62%. There were periods of both positive and negative growth, with the highest growth rate of 32.62% observed in 2018 and the lowest growth rate of -11.08% observed in 2002.
The YoY percentage changes of manufacture of basic metals, metallurgical processing, and foundry activities showed significant fluctuations over the years, ranging from -39.05% to 41.23%. There were periods of both positive and negative growth, with the highest growth rate of 41.23% observed in 2021 and the lowest growth rate of -39.05% observed in 2009.
Overall, the manufacturing sectors analyzed in the table exhibited varying degrees of YoY percentage changes over the years, reflecting fluctuations in the respective industries. Some years showed positive growth, while others showed negative growth, indicating changes in the demand, production, and economic conditions affecting these sectors.
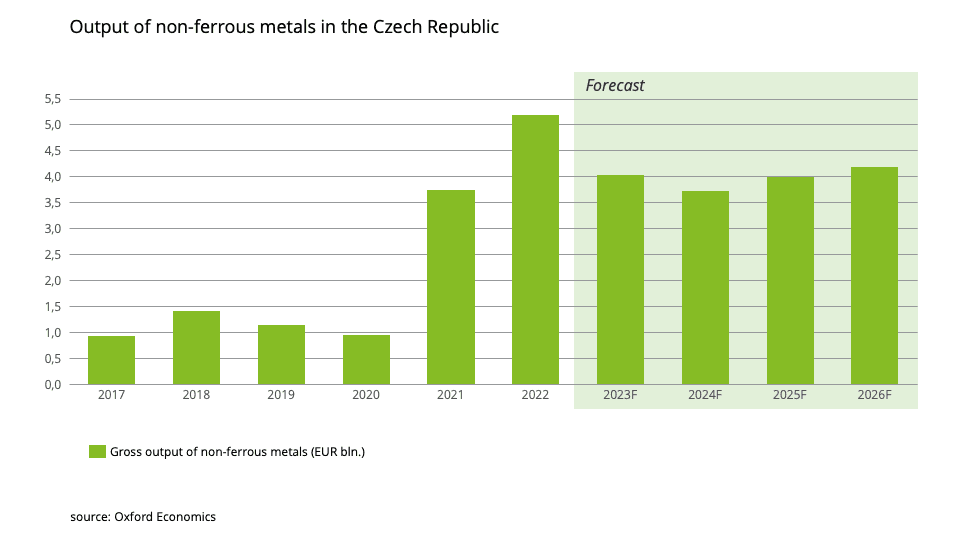


The gross output of non-ferrous metals shows a fluctuating trend over the years, with a decrease from 2017 to 2020, followed by a significant increase in 2021 and 2022, and a slight decrease in the forecasted years 2023 to 2026.
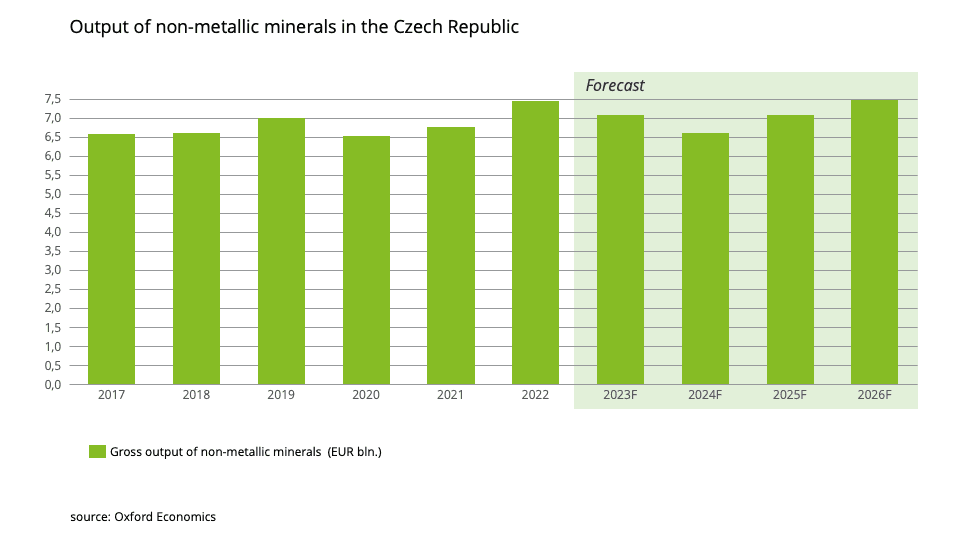
The gross output of non-metallic minerals shows a relatively stable trend over the years, with minor fluctuations. It has been increasing gradually from 2017 to 2022, and the forecasted years 2023 to 2026 show a similar upward trend.
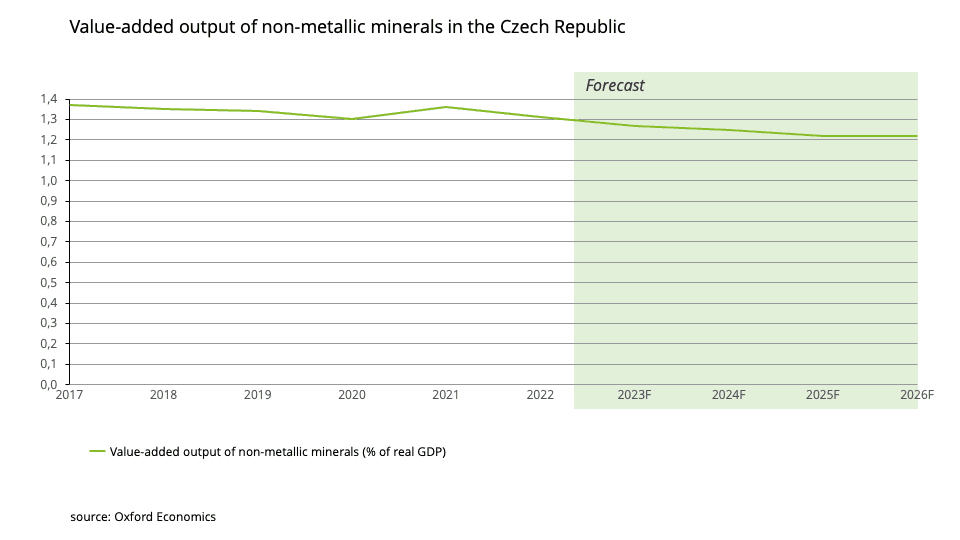
The value-added output of non-metallic minerals, expressed as a percentage of real GDP, has been declining gradually from 2017 to 2022, with a forecasted decrease in the years 2023 to 2026.
Overall, the data suggests that the gross output of non-ferrous metals and non-metallic minerals has shown some volatility over the years, with different trends for each category. Non-metallic minerals, both in terms of gross output and value-added output, have been relatively stable with a gradual upward trend, while non-ferrous metals have experienced more fluctuations. The value-added output of non-metallic minerals, as a percentage of real GDP, has been declining steadily. It