


Seyfor Gains Full Control of Dotykačka
30 April 2025
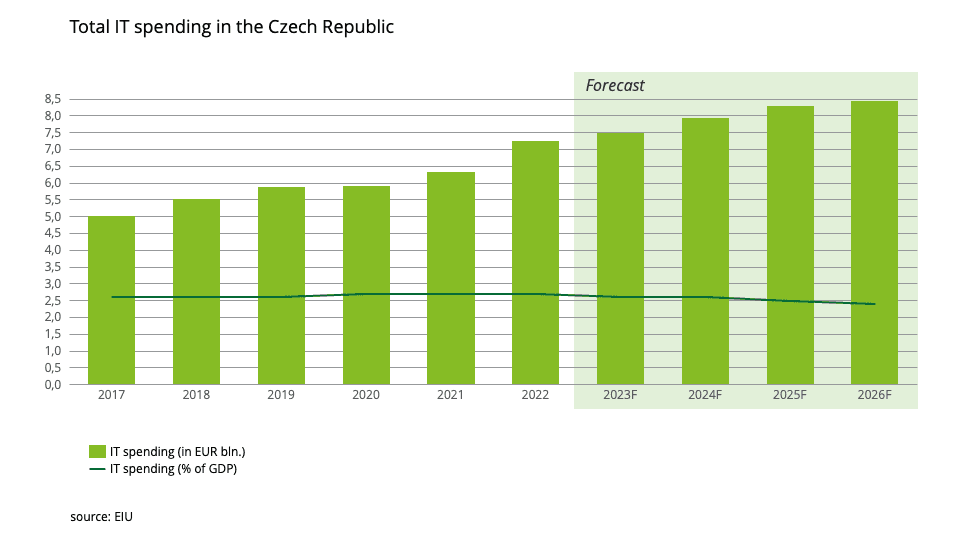
The graph provided the total IT spending in EUR billion in the Czech Republic for the years 2017 to 2026, as well as the percentage of IT spending as a share of GDP (Gross Domestic Product) for the same period.
Total IT spending in EUR billion in the Czech Republic has generally increased over the years, starting from 5.0 EUR billion in 2017 and projected to reach 8.5 EUR billion in 2026. The spending shows a steady growth trend with a significant increase from 6.3 EUR billion in 2021 to 7.2 EUR billion in 2022.
The percentage of IT spending as a share of GDP in the Czech Republic remained relatively stable at 2.6% of GDP from 2017 to 2019, increased slightly to 2.7% in 2020 and 2021, and then declined to 2.6% in 2022. The projected data (2023F to 2026F) shows a further decline in IT spending as a percentage of GDP from 2.6% to 2.4% over the forecasted years.
Overall, the data suggests that IT spending in the Czech Republic has been increasing in absolute terms, but has remained relatively stable or slightly declining as a percentage of GDP in recent years, with a projected further decrease in the coming years. This could indicate that while IT spending is growing, it may not be growing at the same pace as the overall economy, leading to a slight decline in the percentage of IT spending as a share of GDP.
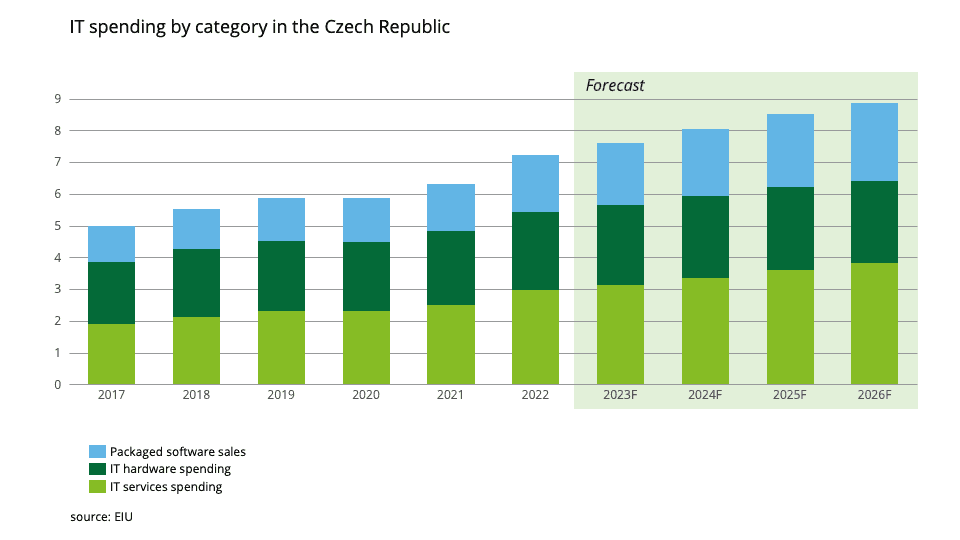
The graph shows the trend of IT spending in three categories: IT services spending, IT hardware spending, and packaged software sales in billions of Euros from 2017 to 2026 (forecasted).
The IT services spending shows a consistent increase in IT services spending from 2017 to 2026, with the highest growth rate in recent years. The spending has increased from 1.90 billion Euros in 2017 to a projected 3.82 billion Euros in 2026.
The IT hardware spending shows a fluctuating trend in IT hardware spending from 2017 to 2026. There was an initial increase from 2017 to 2019, followed by a slight dip in 2020 and 2021, and then a moderate increase in the forecasted years. The spending is projected to reach 2.60 billion Euros in 2026.
The packaged software sales shows a consistent increase in packaged software sales from 2017 to 2026, with steady growth year over year. The spending has increased from 1.13 billion Euros in 2017 to a projected 2.45 billion Euros in 2026.
Overall, the graph indicates that IT spending in the Czech Republic is on an upward trend in all three categories, with IT services spending showing the highest growth rate. This suggests that there is a growing demand for IT services, hardware, and software in the Czech Republic, and businesses and consumers are investing more in these areas.
Seyfor Gains Full Control of Dotykačka
30 April 2025
ARX and Sandberg Acquire Travelnode Together
25 April 2025
HTEC from Silicon Valley bought Czech CertiCon
6 March 2025


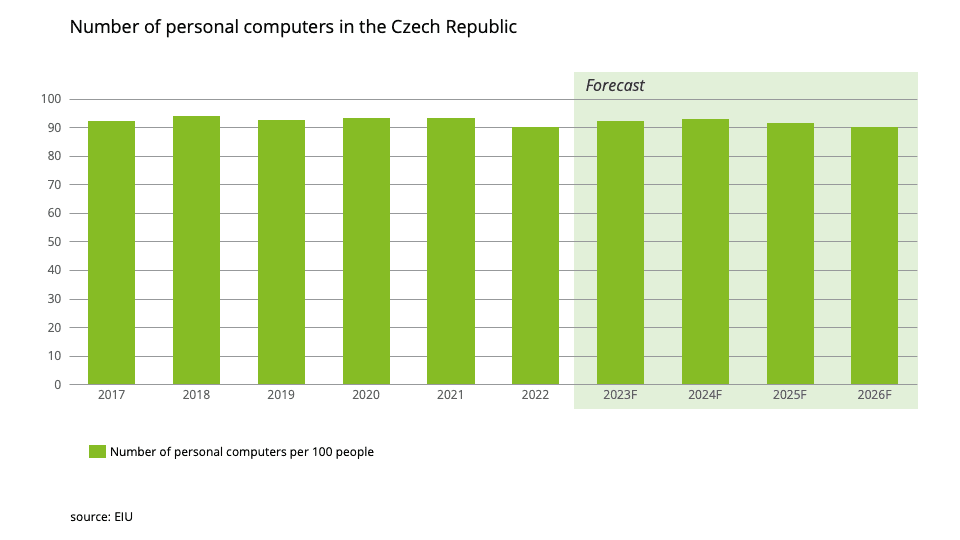
From 2017 to 2019, there was a gradual increase in the number of personal computers per 100 people, reaching its highest point in 2018 at 94. However, in 2020 and 2021, there was no change, with the number remaining steady at 93.3. In 2022, there was a decrease to 90.1 personal computers per 100 people, indicating a decline in PC penetration. However, in 2023 and beyond (forecasted data), there is a slight recovery with the number increasing to 92.2 in 2023 and stabilizing around 91.7 to 93 from 2024 to 2026. Overall, the penetration of personal computers in the Czech Republic has reached a plateau in recent years, with a slight decline in 2022, but a modest recovery expected in the future.
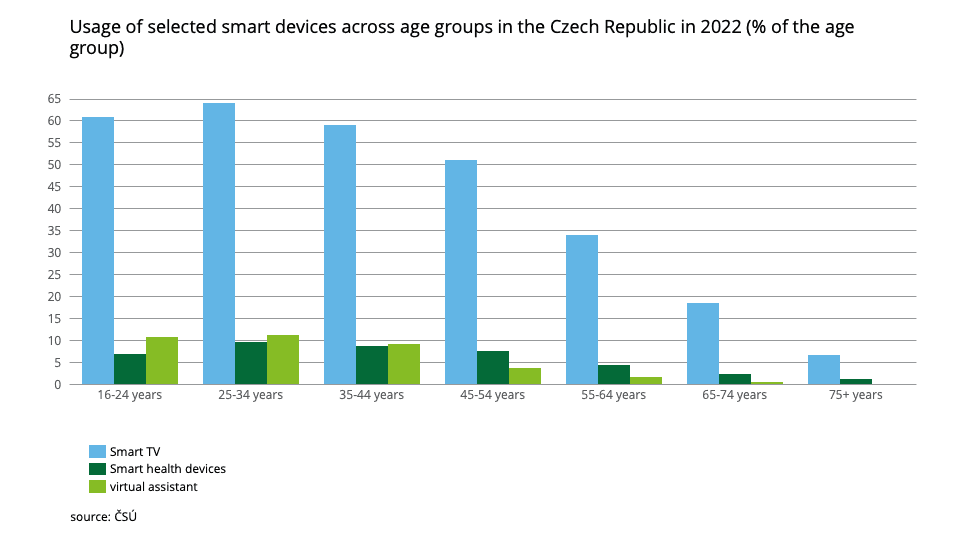
Usage of selected smart devices across age group Overall, younger age groups in the Czech Republic tend to have higher usage of smart devices such as Smart TVs, Smart Health Devices, and Virtual Assistants, while older age groups show lower usage. This may be indicative of generational differences in technology adoption and usage patterns.
The percentage of Smart TV usage tends to decrease with age. The highest usage is seen in the 25-34 years age group at 64.2%, followed by the 16-24 years age group at 61%. The usage then gradually declines in older age groups, with the lowest usage observed in the 75+ years age group at 6.8%.
The percentage of Smart Health Devices usage also tends to decrease with age. The highest usage is seen in the 25-34 years age group at 9.7%, followed by the 35-44 years age group at 8.9%. The usage then declines in older age groups, with the lowest usage observed in the 75+ years age group at 1.4%.
The usage of Virtual Assistants follows a similar trend, with higher usage in younger age groups and lower usage in older age groups. The highest usage is seen in the 25-34 years age group at 11.3%, followed by the 16-24 years age group at 10.9%. The usage then decreases in older age groups, with the lowest usage observed in the 75+ years age group at 0.2%.