

MTX Group in talks to take over part of Aluflexpack
5 February 2025
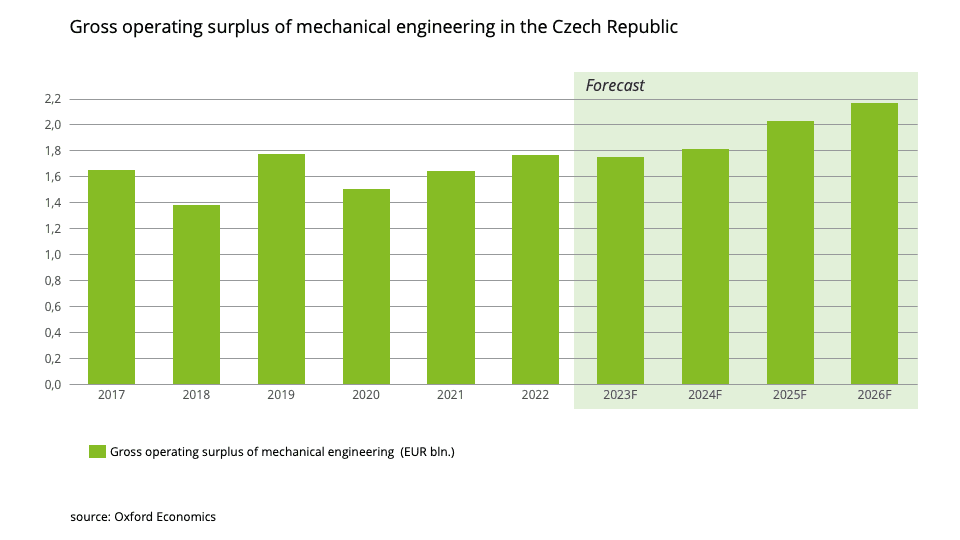
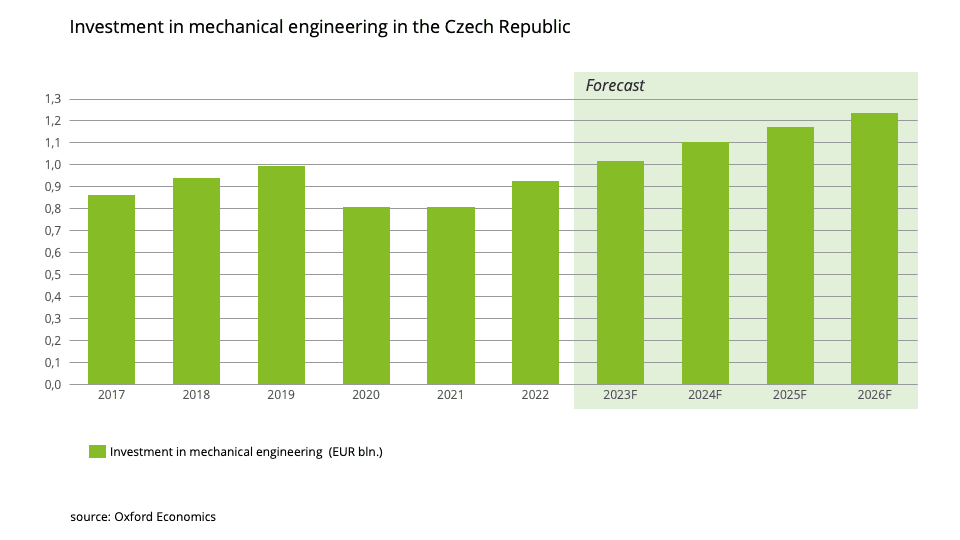
The chart shows the gross operating surplus in nominal EUR billion for the field of mechanical engineering from the year 2017 to 2026 (forecasted). Overall, the gross operating surplus for mechanical engineering shows some fluctuations over the years, with periods of increase and decrease. However, there is an overall upward trend, as the values are generally increasing from 2017 to the forecasted years of 2025 and 2026.
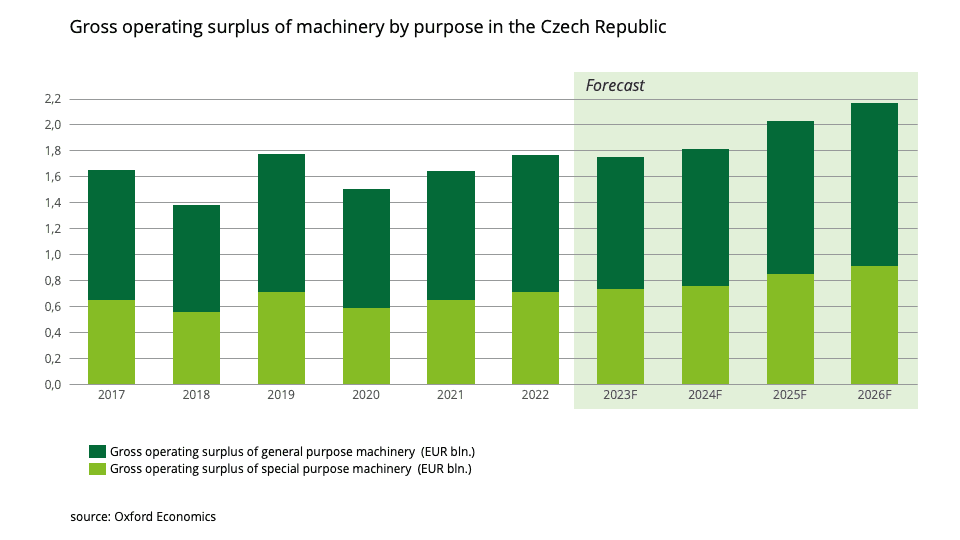
The graph provides data on the gross operating surplus of production of general purpose machinery and special purpose machinery in billions of Euros for the years 2017 to 2026 (forecasted). For general purpose machinery, the gross operating surplus increased from 1.0 billion Euros in 2017 to an estimated 1.3 billion Euros in 2026, with a general upward trend, although with some fluctuations. For special purpose machinery, the gross operating surplus also showed an increasing trend, but with smaller values compared to general purpose machinery. It increased from 0.7 billion Euros in 2017 to an estimated 0.9 billion Euros in 2026.
MTX Group in talks to take over part of Aluflexpack
5 February 2025
European CFO Survey autumn 2024
17 December 2024
AI in manufacturing
3 June 2024


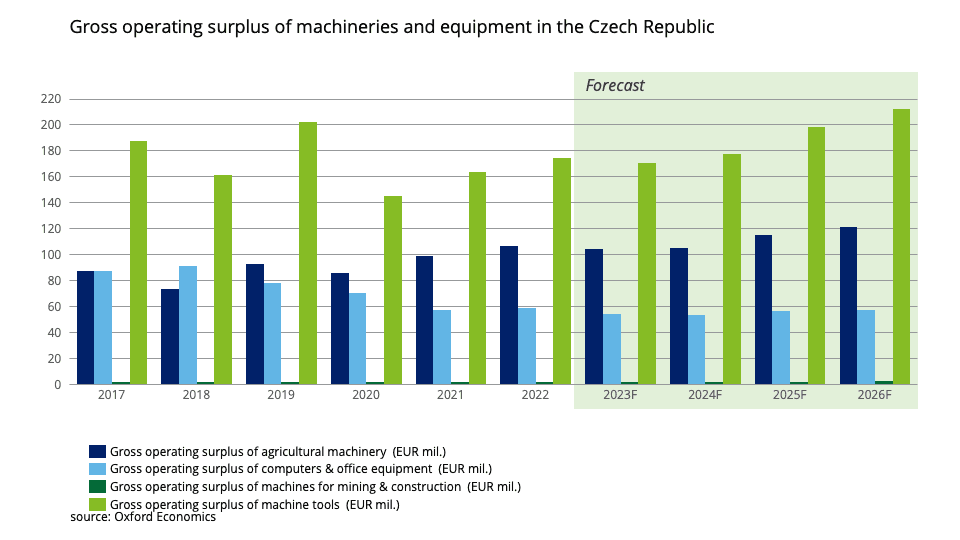
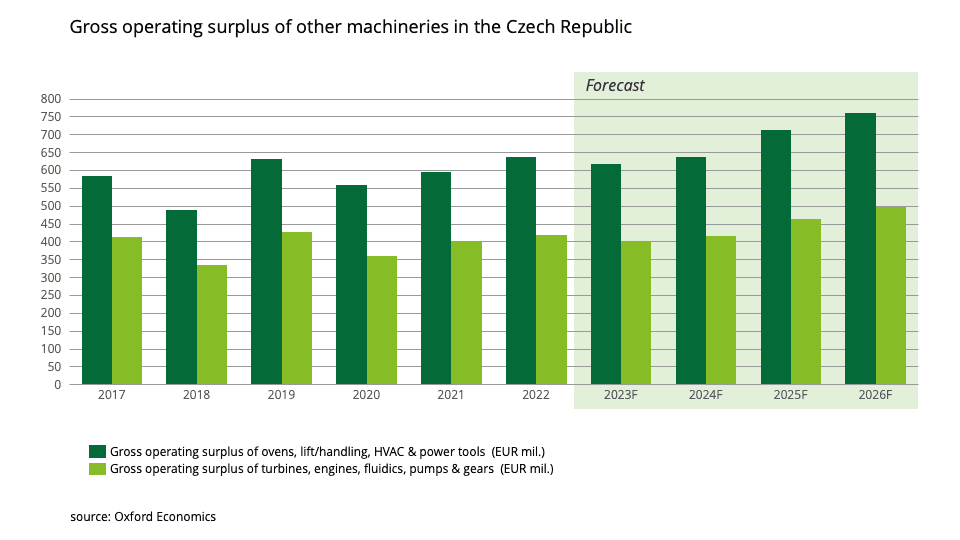
The behavior of the gross operating surplus (in EUR million) of production of machinery for different sectors for the years 2017 to 2026 (forecasted) in the Czech Republic was the following:
The gross operating surplus (in EUR million) for production of different sectors of machinery for the years 2017 to 2026 (forecasted). The sectors included are agricultural machinery, computers & office equipment, machines for mining & construction, and machine tools.
The gross operating surplus agricultural machinery shows a fluctuating trend, with a peak in 2021 (EUR 99.04 million) and a slight dip in 2022 (EUR 107.06 million) before stabilizing and gradually increasing in the forecasted years.
In terms of computers & office equipment, the gross operating surplus shows a declining trend, with a peak in 2018 (EUR 91.64 million) and a steady decrease thereafter. The forecasted years (2023 to 2026) show a relatively stable but declining trend.
Mining & construction's gross operating surplus shows some fluctuations, with a peak in 2017 (EUR 2.28 million) and a dip in 2020 (EUR 1.89 million). The forecasted years (2023 to 2026) show a relatively stable trend with minor variations.
The gross operating surplus of machine tools shows some fluctuations, with a peak in 2019 (EUR 202.17 million) and a dip in 2020 (EUR 145.21 million). The forecasted years (2023 to 2026) show a gradually increasing trend.
For the sector "Ovens, lift/handling, HVAC & power tools", the gross operating surplus has shown a fluctuating trend over the years, starting at 585.64 EUR million in 2017, declining to a low of 489.02 EUR million in 2018, then increasing in 2019 and 2020, and reaching 637.89 EUR million in 2022 (forecasted). It is expected to be 617.55 EUR million in 2023 (forecasted), 637.49 EUR million in 2024 (forecasted), 712.80 EUR million in 2025 (forecasted), and 762.06 EUR million in 2026 (forecasted).
For the sector "Turbines, engines, fluidics, pumps & gears", the gross operating surplus has also shown a fluctuating trend over the years, starting at 412.84 EUR million in 2017, declining to a low of 335.76 EUR million in 2018, then increasing in 2019 and 2020, and reaching 418.48 EUR million in 2022 (forecasted). It is expected to be 403.01 EUR million in 2023 (forecasted), 415.22 EUR million in 2024 (forecasted), 464.48 EUR million in 2025 (forecasted), and 496.64 EUR million in 2026 (forecasted).
In conclusion, the Gross Operating Surplus has generally increased for the production of these machineries over the years from 2017 to 2026.